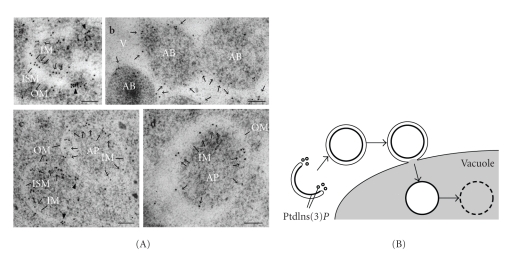
Figure 3.
Dynamics of PtdIns(3)P during autophagy. (A) BJ2168 cells expressing mRFP-2xFYVE were cultured in nitrogen-depleted medium for 3.5 h and then subjected to immunoelectron microscopy with an affinity-purified anti-FYVE antibody. Gold particles on the inner membrane (IM) of the isolation membrane (ISM in (a) and (c)), the autophagosome (AP in (c) and (d)), and the autophagic body (AB in (b)) membranes are indicated by arrows. Arrowheads in (a) and (c) indicate gold particles near the tips of the isolation membranes. Ribosomes can be distinguished because they appear hazier than the gold particles. OM, outer membrane. V, vacuole. Bars, 100 nm. (B) Summary of the PtdIns(3)P dynamics during autophagy. PtdIns(3)P-enriched sites are shown in bold lines. Reproduced from [23] (Copyright 2008 by the Molecular Biology Society of Japan/Blackwell Publishing Ltd) and from [37] (Copyright 2008 by Landes Bioscience).

