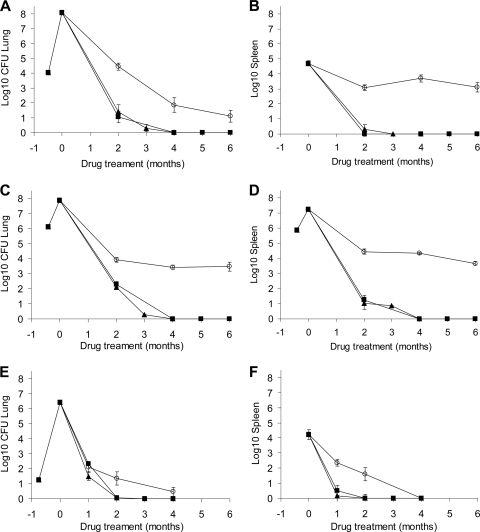
FIG. 2.
Comparison of HDA and LDA infection models with i.v. infection in BALB/c mice treated with different drug combination regimens. (A, C, and E) Bacterial numbers in lungs of BALB/c mice after HDA (A), i.v. (C), or LDA (E) infection with M. tuberculosis and 1, 2, 3, 4, 5, or 6 months of drug treatment. (B, D, and F) Bacterial numbers in spleens after HDA (B), i.v. (D), or LDA (F) infection and 1, 2, 3, 4, 5, or 6 months of drug treatment. Drug treatment regimens included either 2 months of INH, PZA, and RIF followed by INH and RIF (▪); 2 months of MXF, PZA, and RIF followed by MXF and RIF (▴); or 6 months of PZA and RIF (○).

