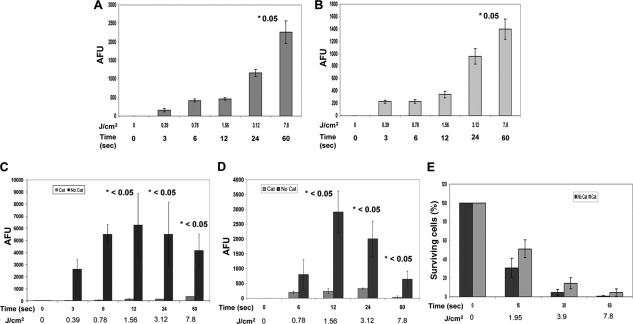
FIG. 4.
Plasma treatment generates detectable amounts of reactive oxygen species (ROS). (A and B) Generation of singlet oxygen (1O2)-like ROS upon exposure to plasma treatments, as detected by specific fluorescence from molecular probes. (A to D) Plasma treatments produced ROS in both the medium (PBS) (A and C) and the E. coli cells (B and D). The plasma treatment time (in seconds) and the corresponding amount of energy (in J/cm2) are shown on the x axes. Arbitrary fluorescence units (AFU), an indicator of the corresponding ROS, are shown on the y axes. (For details, see Materials and Methods.) (C) The generation of hydrogen peroxide (H2O2)-like species upon exposure to plasma treatments is detected using a specific fluorescence molecular probe, and catalase-mediated scavenging is observed. Plasma exposure produced hydrogen peroxide in both the medium (PBS) (C) and the E. coli cells (D). Cat, catalase. (E) A colony assay demonstrating catalase-mediated protection to E. coli during plasma treatment is shown. The numbers above the bars and preceded by an asterisk are P values comparing the value with either the value for the corresponding untreated sample (A and B) or the relevant corresponding condition (with catalase or without catalase) (C and D). A statistically nonsignificant but appreciable amount of protection by catalase was seen in panel E. The values are means ± SDs (error bars) for 3 experiments.

