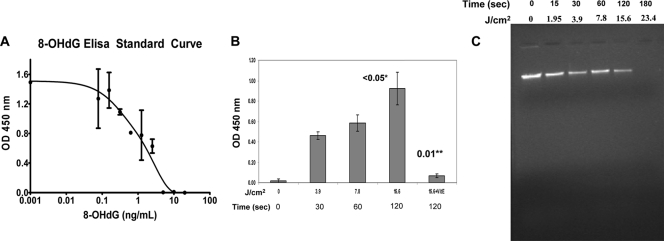
FIG. 7.
The oxidative DNA damage marker 8-hydroxydeoxyguanosine (8-OHdG) appears as the oxidative stress increases. (A) A graph showing detection of 8-OHdG with serially diluted solutions of 8-OHdG by ELISA technique. This standard curve was used for comparison with experimental conditions. (B) Plasma dose (energy)-dependent response showing increasing appearance of 8-OHdG, which was is inhibited significantly upon pretreatment and the treatment in the presence of an antioxidant, vitamin E (VitE). Error bars show SDs. The number above the bar followed by one asterisk is the P value comparing the value to the value for the untreated control. The number followed by two asterisks is the P value comparing the value to the value for corresponding plasma condition without antioxidant (VitE). (C) The ethidium bromide-stained agarose gel, showing fragmentation of genomic DNA of E. coli cells as the amount of plasma energy application increases. The length of time of plasma treatment of the cells (in seconds) and corresponding energy of plasma treatment (in J/cm2) are shown above the gel.

