Figure 2.
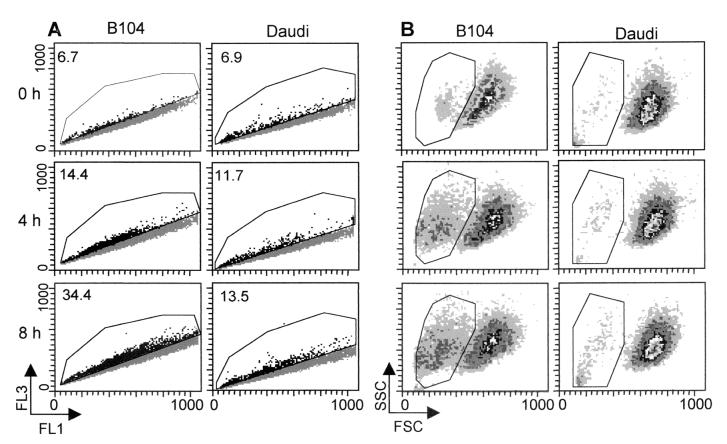
The effect of anti-IgM stimulation on the pHi and size of B104 vs. Daudi cells. Cells (5 × 10⁵) treated with 20 μg/ml anti-IgM for the indicated times were loaded with BCECF-AM and analyzed by flow cytometry. Their distribution, according to the pHi, was determined from the two-dimensional scatter plot of the fluorescence intensities at 520 nm (FL1, base) and 640 nm (FL3, acid) (A), and cell size determined from the forward (cell size) vs. side light scatter (cell granularity) plots (B). The shift of cells toward the FL3 axis indicates a decrease in their pHi. The gated events indicate the acidic subpopulation (pHi 6.65 ± 0.09). The percentage of cells in the gated area is indicated in the upper left corners. These are the results of a representative experiment of three experiments performed.

