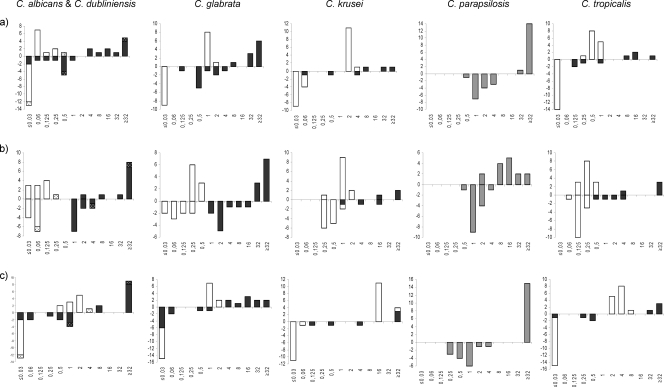
FIG. 1.
MIC distributions obtained following EUCAST methodology but supplementing the medium with 50% BSA (above the x axis) and obtained by the standard procedure (below the x axis) for susceptible isolates (white bars) and FKS mutant isolates (black bars). (C. dubliniensis isolates are indicated with dotted bars.) (a) MICs of anidulafungin. (b) MICs of caspofungin. (c) MICs of micafungin.

