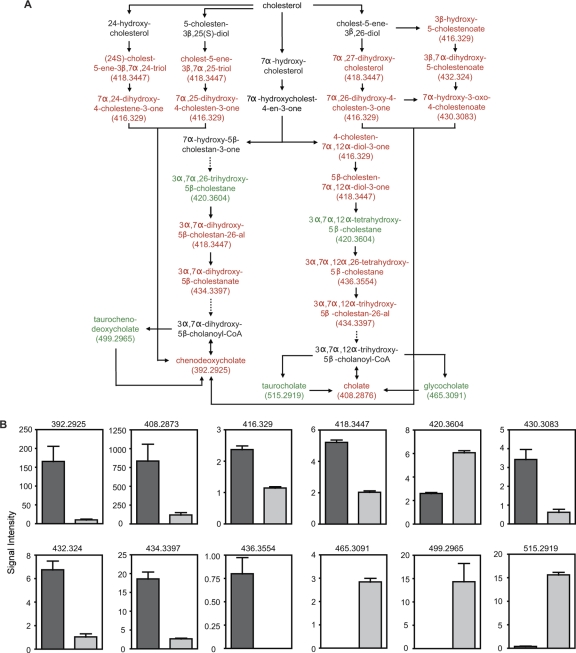
FIG. 4.
Bile acid metabolism is disturbed by antibiotic treatment. (A) Schematic of the bile acid synthetic pathway. Red, metabolites decreased by antibiotic treatment; green, metabolites increased upon treatment; black, metabolites not detected or unchanged. Masses (Da) for metabolites affected are shown in parentheses. Solid arrows, direct steps; dashed arrows, multiple steps that are not shown. (B) Levels of masses affected by antibiotic treatment. Masses (Da) are shown at the top of each graph. The y axis indicates mass signal intensity. Dark gray bars, levels before treatment; light gray bars, levels after antibiotic treatment. Four mice (n = 4) were used, and averages with standard errors of the means are shown. Because masses 392.2925, 408.2876, 430.3083, 432.324, and 499.2965 were detected in both positive and negative ionization modes, the intensities of these masses in both ionization modes were combined before analysis (n = 8). All differences were statistically significant (P < 0.05). CoA, coenzyme A.

