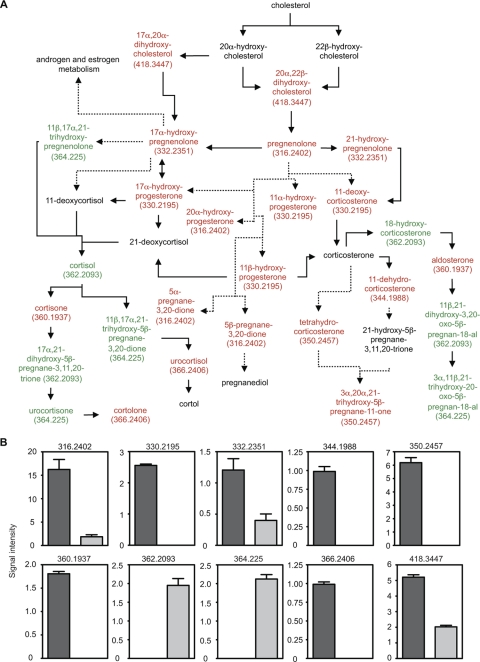
FIG. 5.
Antibiotic treatment disrupts steroid hormone metabolism. (A) Schematic of the steroid hormone metabolic pathway. Red, metabolites decreased by antibiotic treatment; green, metabolites increased upon treatment; black, metabolites not detected or unchanged. Masses (Da) for metabolites affected are shown in parentheses. Solid arrows, direct steps; dashed arrows, multiple steps that are not shown. (B) Levels of masses affected by antibiotic treatment. Masses (Da) are shown at the top of each graph. The y axis indicates mass signal intensity. Dark gray bars, levels before treatment; light gray bars, levels after antibiotic treatment. Four mice (n = 4) were used, and averages with standard errors of the means are shown. All differences were statistically significant (P < 0.025).

