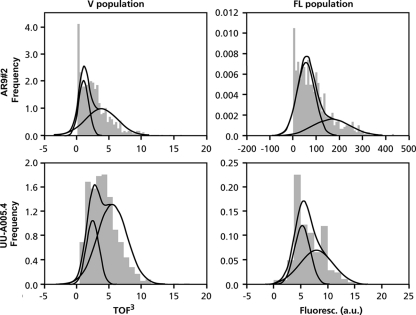
FIG. 1.
Heterogeneity of microcolonies of A. niger in liquid shaken cultures with respect to size and gene expression. The dark gray areas represent the distribution of volume (V population) and glaA and faeA expression (FL population) of microcolonies within liquid cultures. These distributions can be explained by assuming the existence of two populations of microcolonies (indicated by the curves). Strains AR9#2 and UU-A005.4 express GFP from the glaA and the faeA promoters, respectively. a.u., arbitrary units.

