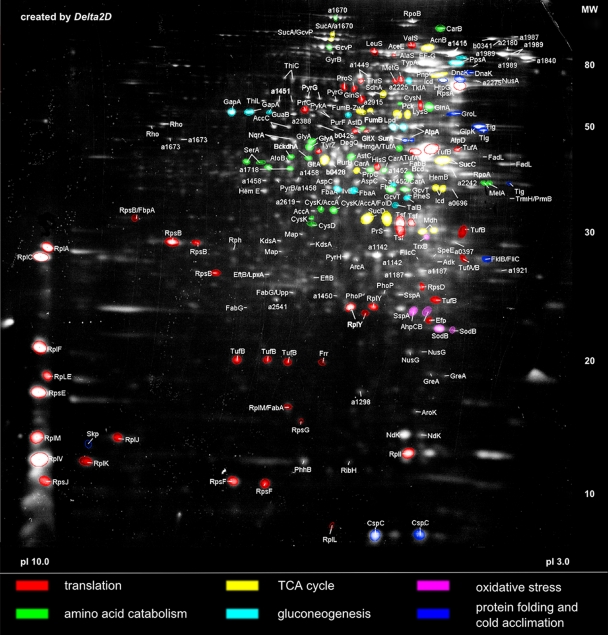
FIG. 1.
The most abundant functional categories of the cytoplasmic proteome of P. haloplanktis TAC125. The protein fraction was two-dimensionally separated at a pH range of 3 to 10. Specific functional groups are indicated by the different colors of the protein spots. MW, molecular weight (in thousands).

