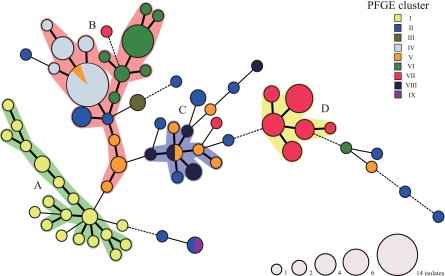
FIG. 2.
Minimum-spanning tree based on MLVA allelic profiles showing the phylogenetic relationships between representative isolates of the 116 PFGE patterns. Each node represents a unique MLVA profile. The nodal size is proportional to the number of isolates per MLVA. The colors indicate PFGE clusters. The different lines indicate the distance between the circles, where a thick line represents a closer distance than a thin line, and a thin line denotes a closer distance than a dotted line. The MLVA clusters differing by 0 or 1 VNTR locus are regarded as a group and are highlighted (MLVA cluster A, green; cluster B, pink; cluster C, blue; cluster D, yellow).

