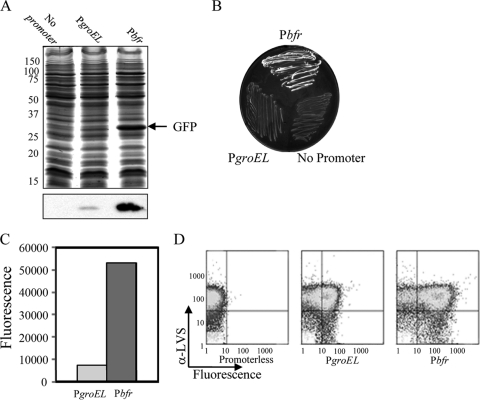
FIG. 4.
Comparison of relative potencies of the bfr and groEL promoters determined by GFP expression. (A) SDS-PAGE (top) and Western blot (anti-GFP, bottom) analyses of F. tularensis LVS cell extracts expressing GFP from indicated promoters cloned in the pTRAP vector. Bacterial cultures were collected 12 h postinoculation. (B) Direct inspection of fluorescence emitted by cells expressing GFP from the indicated promoters. (C) Quantification by direct fluorimetry of GFP fluorescence levels emitted by cells expressing GFP from either the bfr or groEL promoter. Fluorescence quantification was carried out with cultures of identical densities. (D) FACS analysis for quantification of GFP fluorescence levels emitted by equal numbers of cells expressing GFP from either the bfr or groEL promoter.

