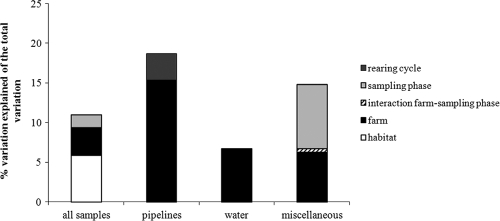
FIG. 3.
Contribution of spatially (habitat, farm) and temporally (rearing cycle, sampling phase) structured variation to the total variation in free-living protozoan community composition for the whole data set (all samples) and for each habitat separately. Only significant variables were included in the analysis (see the text for more details).

