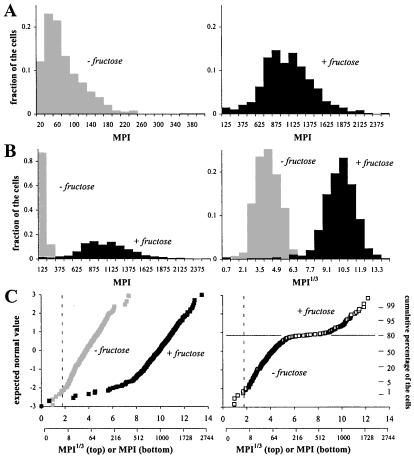
Figure 2.
Distribution profiles of single-cell GFP content in Eh299R (pPfruB-gfp[AAV]) cells from cultures that were supplemented with 0 or 167 μM fructose. See text for details. Note that due to the nature of the cube-root transformation, the MPI1/3 axis disproportionally overrepresents low values. An auxiliary axis shows corresponding MPI values. The broken lines in C mark the limit of GFP detection: MPI1/3 values above this limit were significantly different from background fluorescence (see Materials and Methods).

