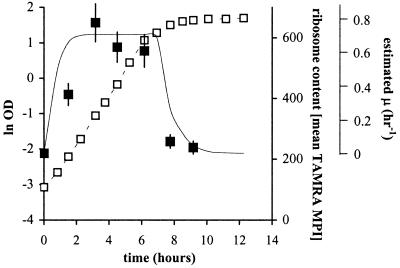
Figure 4.
Correlation between ribosome content and growth rate of a Eh299R (pPfruB-gfp[AAV]) culture in minimal medium on galactose. Shown as a function of time are cell density (□) and average single-cell TAMRA-fluorescence intensity (■). The solid curve represents the change in growth rate as estimated from the slope of the growth curve (μmax = 0.71 h−1).

