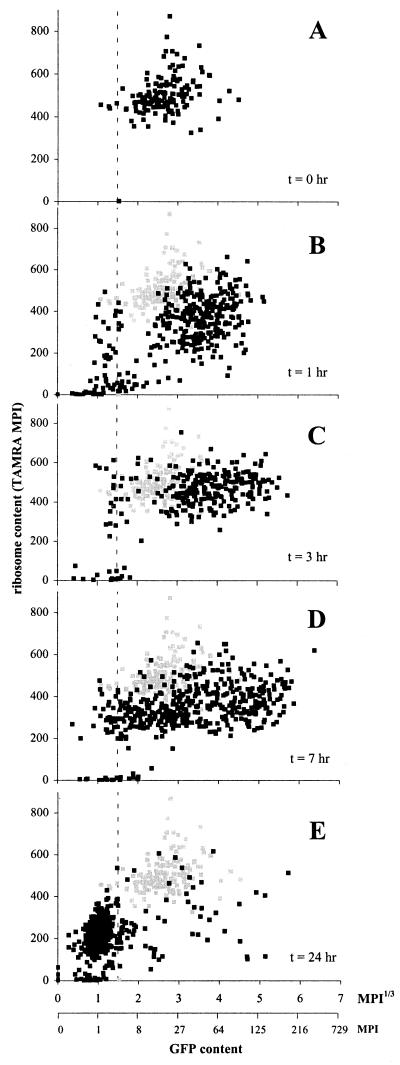
Figure 5.
Scatter plot of GFP and TAMRA fluorescence for individual cells from epiphytic populations of Eh299R (pPfruB-gfp[AAV]) that were recovered from leaves 1, 3, 7, and 24 h after inoculation (t = 0). The gray scatter in B–E refers to the inoculum population. Because we observed no major differences in the distribution patterns among three leaves taken at each time point, we grouped, analyzed, and presented the data as if they were obtained from a single leaf. Broken lines indicate the limit of GFP detection.

