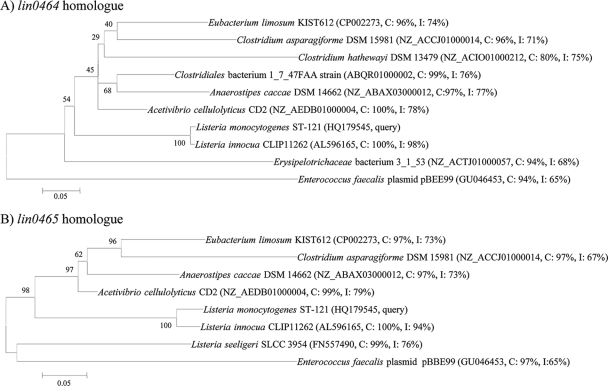
FIG. 3.
Maximum-parsimony tree of the BLAST hits against the lin0464 homologue (top) and the lin0465 homologue (bottom) of L. monocytogenes ST-12. The tree was generated by using MEGA (v. 4.0) software (16). The scale bar represents a distance of 5%. Accession numbers are from GenBank. Bootstrap values of 500 trees are indicated as percent confidence values for the branching. GenBank accession numbers, query coverages (C), and identities (I) are given in parentheses.

