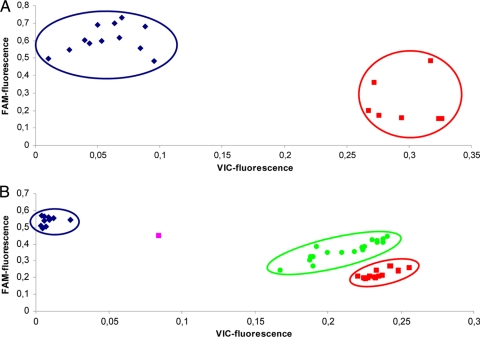
FIG. 1.
Representative allelic discrimination plots. (A) SNP 2287 located on a single-copy gene. Blue circle, presence of adenine (white and gray squares in Tables 2 and 3); red circle, presence of guanine (gray and white squares in Tables 2 and 3). (B) SNP 7726 located on the multicopy IS1111 element. Blue circle, presence of guanine only (white and green squares in Tables 2 and 3); red circle, presence of cytosine only (green and white squares in Tables 2 and 3); green circle and single pink dot, presence of both guanine and cytosine (dark green and dark green and light green and dark green squares in Tables 2 and 3, respectively) in distinct quantities.

