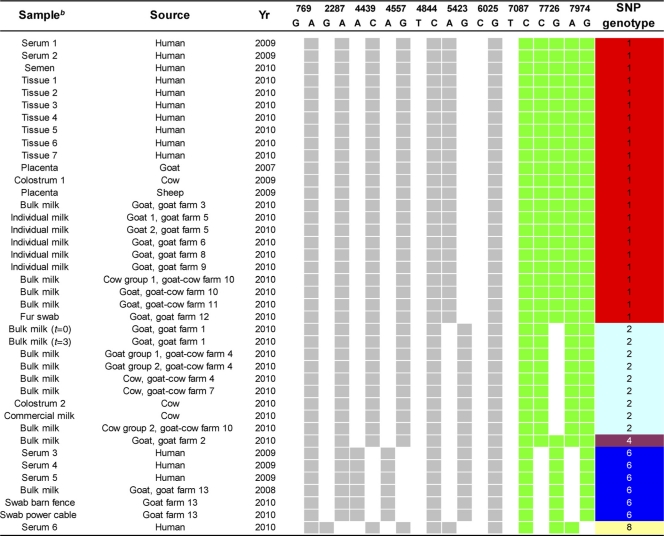
TABLE 3.
Panel of Dutch Q fever outbreak samples, SNP-based genotyping results, and SNP genotypesa
Gray and white squares indicate the presence and absence of the allele for the SNPs located within the single copy genes, respectively (Fig. 1A). Dark green and white squares indicate the presence and absence of the allele for the SNPs located within the multicopy IS1111 element, respectively (Fig. 1B). A, adenine; G, guanine; C, cytosine; T, thymine. Matching colors in the SNP genotype column represent identical SNP profiles.
bt, time (days).

