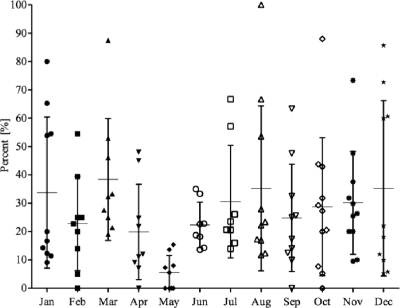
FIG. 1.
Distribution of stx prevalence in commercial ground beef by month. The distribution of the monthly prevalence of stx in commercial ground beef samples is based on PCR screening for the presence of stx1 and/or stx2 over a period of 24 months (n = 4,133). The mean (horizontal bars) and standard deviation (vertical bars) for each month are shown. Each point within a month represents a regional prevalence value. Note that only some regions are represented twice in each month. The STEC prevalence rate in May was significantly lower than the rates during March and November (P < 0.05). All other comparisons between months are not statistically significantly different (P > 0.05).

