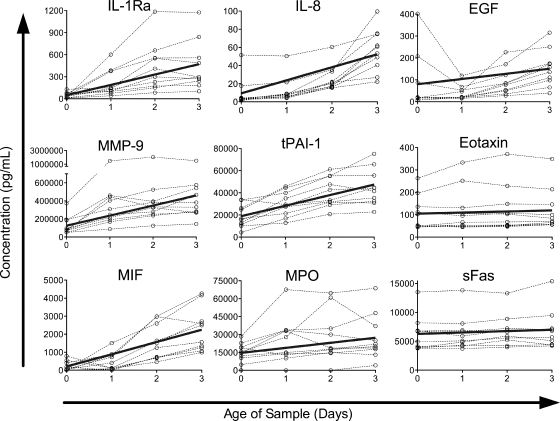
FIG. 1.
Proteins with significant increases in concentration over time in a healthy-donor cohort. Protein concentrations in healthy-donor samples versus time since collection are plotted by individual for all proteins in which the model detected a significant increase over time (P < 0.05). Data for each individual are connected by dashed lines. Solid lines represent the predicted change over time, calculated by the equation y = (mean at t = 0) + (coefficient) × x.

