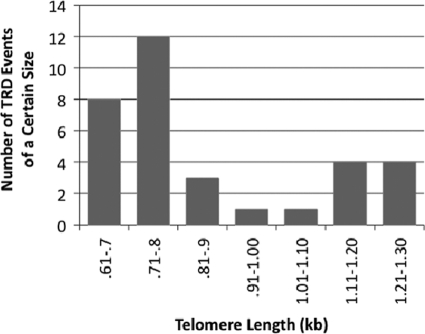
Fig. 2.
Summary of telomere lengths after TRD. The bar graph shows the length distribution of 33 of the TRD events observed. The telomere length was measured as the size of the XhoI Bcl telomeric fragment after TRD, and the vertical axis shows the number of samples which were shortened to within a given size range.

