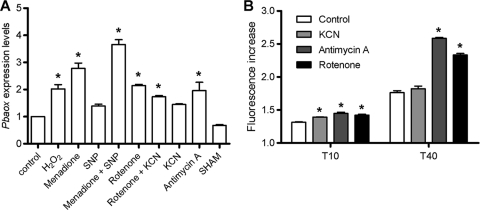
Fig. 6.
The effect of ROS/RNS-generating compounds on the expression levels of Pbaox and the generation of intracellular ROS during the exponential growth phase of P. brasiliensis yeast cells. (A) Cell cultures and ROS/RNS-generating compound challenges were performed as described in Materials and Methods. The number of Pbaox transcripts was determined and normalized as previously described. The concentrations of the compounds in each addition were as follows: for H2O2, 30 mM; for menadione, 0.5 mM; for SNP, 1 mM; for rotenone, 2 μM; for KCN, 1 mM; for antimycin A, 1.8 μM; and for SHAM, 2 mM. These values represent the expression levels relative to the level for the control and are presented as averages ± SEMs of results from three independent assays. (B) Cell culture, spheroplast generation, and ROS measurement procedures were performed as described in Materials and Methods. Spheroplast cells (5 × 10⁶ cells/ml) were loaded with the CM-H2DCFDA fluorescent probe (5 μM) for 30 min at 37°C. The oxidation of the probe by ROS was monitored using a Hitachi F-4500 fluorescence spectrophotometer at 30°C under agitation. The excitation and emission wavelengths were 503 and 529 nm, respectively. The concentrations of the inhibitors in each addition were as follows: for KCN, 1 mM; for antimycin A, 1.8 μM; and for rotenone, 2 μM. The values for fluorescence represent increases at 10 and 40 min in comparison to the value observed at time zero (before the addition of inhibitors), and these values are shown as the averages ± SEMs of results from three independent assays. Asterisks indicate P values of <0.05. The statistical analyses are described in Materials and Methods.

