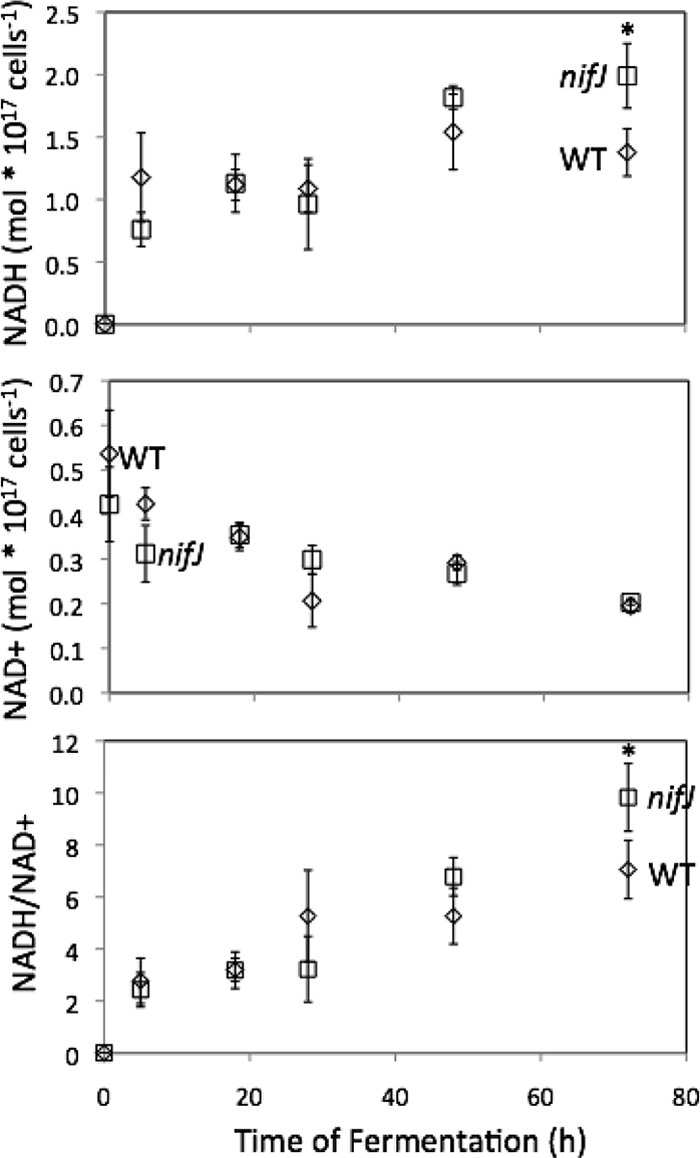
FIG. 8.

Intracellular concentrations of NADH and NAD+ and ratio of NADH/NAD+ for WT and nifJ cells of Synechococcus sp. strain PCC 7002 determined by LC/MS. Time zero was measured at the onset of anoxic conditions. Concentrations of NAD+ and NADH were measured with LC/MS. Error bars represent ± one standard deviation calculated from the results of three biological replicate experiments. Asterisks indicate data that are not significantly different (P = 0.1; 2-tailed t test).
