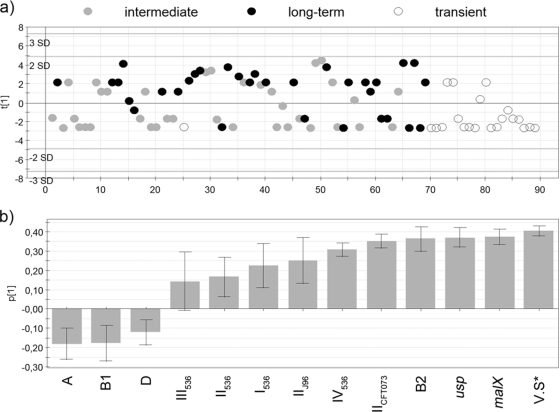
FIG. 3.
Projections to latent structures by means of partial least square (PLS) was used to relate two data matrices, i.e., the X variables, including the virulence score and phylogenetic group, and the responder Y variable (persistence) to each other by a linear multivariate model. The model resulted in one component, which is on the y axis. (a) The score plot shows the position of observations (strains) along the principal component (y axis). Long-term colonizers (black dots) were mainly gathered on the positive axis and transient strains (white dots) on the negative axis. Intermediate colonizers (gray dots) appeared at either side. (b) Loadings, i.e., the variables generating the observed separation. PAI markers and virulence determinants, phylogenetic group, and the virulence score (V.S*) are included.

