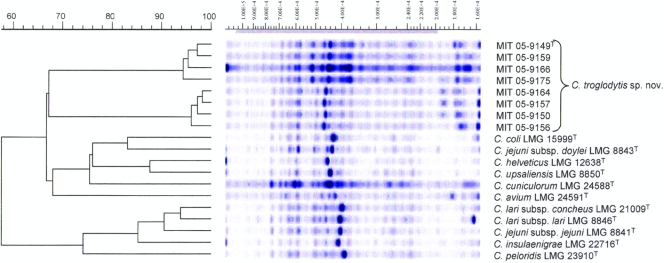
FIG. 2.
Dendrogram and whole-cell protein profiles of eight chimpanzee strains and of type or reference strains of their nearest phylogenetic neighbors. The similarity of the obtained normalized patterns was determined by the Pearson product moment correlation coefficient, and clustering was performed by UPGMA.

