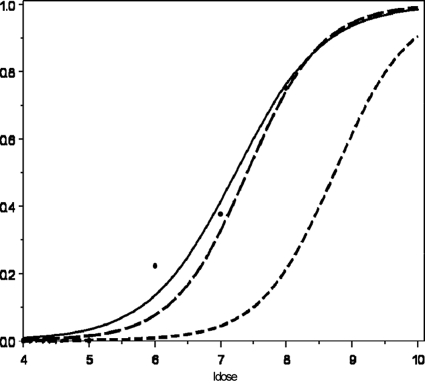
FIG. 2.
Dose-response of L. monocytogenes for dam spleen infectivity (51) and combined models (which use all organs to estimate the b parameter in the log-logistic model but which use only the spleen data for ID50) for both the outbreak-associated (N1-054) and the virulence-attenuated (N1-040) strains used in the current study. The proportion of infected tissues is indicated on the y axis, and the log10 CFU dose (ldose) is indicated on the x axis. The dose-response curves for spleen infectivity were constructed with a log-logistic model. Raw spleen data from Williams et al. (51) are represented by the large black solid dots. The log-logistic model used to fit the dam spleen data from Williams et al. (51) is represented by the solid line; the log-logistic combined model for the outbreak-associated epidemic clone strain (CSUFSL N1-054) is represented by the line with longer dashes, and the log-logistic combined model for the strain carrying the most broadly distributed inlA PMSC (CSUFSL N1-040) is represented by the line with shorter dashes.

