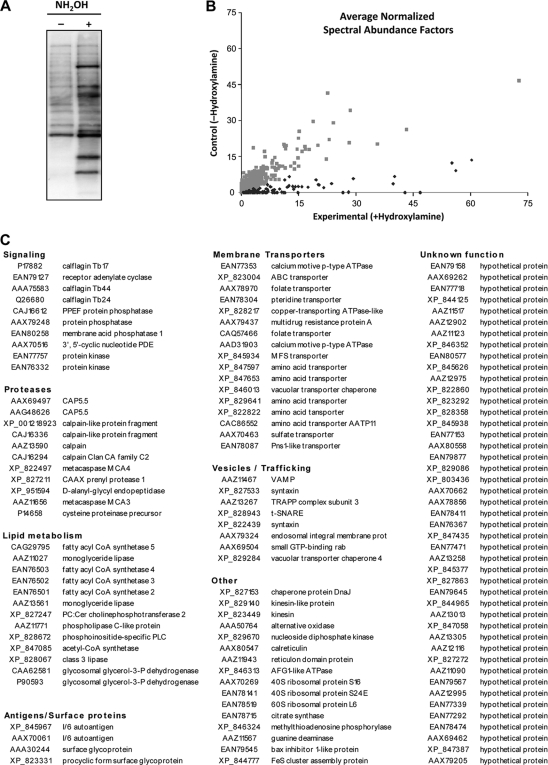
Fig. 5.
The T. brucei palmitoyl proteome. (A) Acyl biotin exchange samples prepared from procyclic-stage T. brucei were fractionated by SDS-PAGE, transferred to nitrocellulose membranes, and probed with streptavidin-HRP to detect total lysate labeling under each condition. (B) Individual proteins purified by streptavidin chromatography from acyl biotin exchange samples were identified by LC/MS-MS. Their relative abundances were quantified and normalized for experimental and control conditions. In this graphical representation, each point represents an individual protein, with its coordinates indicating its abundance under each condition. Thus, proteins clustered along the x axis show high NH2OH dependence for their purification and, by extension, palmitoylation. Gray dots represent those proteins deemed insignificant by statistical analysis, while black dots represent proteins that met the threshold for significance. (C) The T. brucei palmitoyl proteome (n = 124 proteins) is listed, with corresponding NCBI accession numbers and functional groupings.

