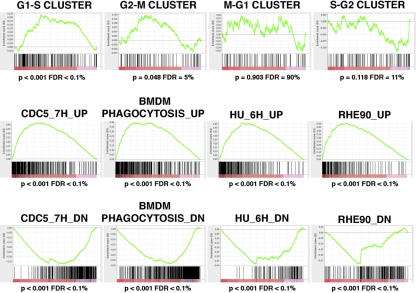
Fig. 5.
Gene set enrichment analysis (GSEA) of the transcriptional profile of Swi4p- and Swi6p-depleted cells. A ranked list of genes modulated in Swi4p- and Swi6p-depleted cells was compared to 29 gene sets of 64 to 558 genes that exhibit cell cycle-dependent periodic expression in C. albicans opaque cells (26) or significant changes during polar morphogenesis, including yeast-to-hypha transitions and the production of highly elongated buds due to M or S phase arrest (5, 34, 43, 53, 58, 71). Genes in the ranked list are organized along the x axis with upregulated genes to the left and downregulated genes to the right. The positions of the genes in each gene set are illustrated by the vertical black bars, while the green curve represents the cumulative value of the enrichment score (y axis). Graphs of selected results are shown, while the complete GSEA output folder is included as GSEA data file S1 in the supplemental material. BMDM, bone marrow-derived monocytes; RHE90, reconstituted human epithelial cells; HU, hydroxyurea.

