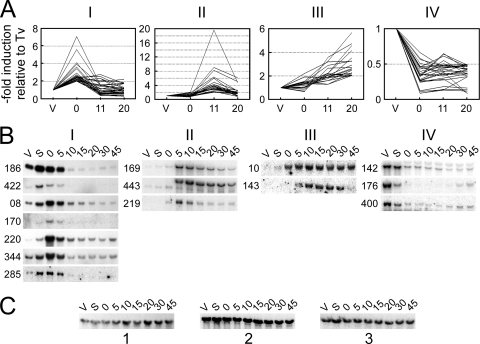
Fig. 1.
Four characteristic gene expression patterns during autogamy in P. tetraurelia. (A) Graphic representation of the four major expression profiles identified during the analysis of Megabase microarrays. For each probe, the graph shows the variations of the average normalized microarray hybridization signal obtained throughout autogamy for stock d4-2 (0, 11, and 20, time in hours), relative to the value calculated for the same probe for vegetative cells (V or Tv). At time zero (T0), 50% of cells had fragmented old MACs and amplification of germ line DNA had started in the developing new MACs but no products of IES excision were detected (see Fig. S1 in the supplemental material). At T11, double-strand breaks were readily detected at IES ends but only a few excised molecules were observed. At T20, IES elimination from chromosomes and accumulation of excised circles had become conspicuous. Probes with the largest induction or repression factors were selected within each cluster by applying the following filters: T0/TV > 2 for cluster I (30 probes), T11/TV > 2 for cluster II (23 probes), T20/TV > 2 for cluster III (20 probes), and T0/TV < 0.5 for cluster IV (31 probes). The full data set can be found in Tables S2 (cluster I), S3 (cluster II), S4 (cluster III), and S5 (cluster IV) in the supplemental material. (B) Validation of clusters by Northern blot hybridization of total RNA from stock 51 during autogamy (V, vegetative cells; S, starved cells; 0 to 45, autogamy time points in hours; see Fig. S2A in the supplemental material). Three identical blots were used in parallel for the successive hybridization of individual 32P-labeled gene probes. (PTMB gene numbers are shown on the left of each panel. For clarity, gene orientation relative to Megabase sequence is not indicated.) Details for all hybridization probes are listed in Table S6 in the supplemental material. (C) Loading control for the Northern blots shown in panel B using a 32P-labeled 17S ribosomal DNA probe. Blot 1 was used for PTMB.186c, PTMB.422c, PTMB.08c, PTMB.170c, PTMB.220, and PTMB.344c. Blot 2 was used for PTMB.285c, PTMB.169c, PTMB.443c, PTMB.143c, PTMB.142c, PTMB.176c, and PTMB.400c. Blot 3 was used for PTMB.219 and PTMB.10c.

