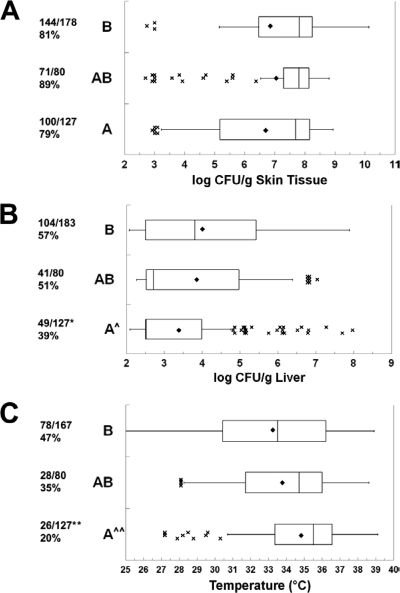
FIG. 3.
Relationship between 16S rrn ribotype and virulence. Box plots show the relationships between rrn type and (A) skin infection, (B) liver infection, and (C) body temperature at euthanasia. The rrn genotypes are shown on the left. The fractions are the numbers of mice with detectable skin infections (A), detectable liver infections (B), or body temperatures of less than 33°C (surrogate for death) (C) over the total number of mice of that genotype for which data are available. The percent positive is shown below the fraction. The boxes show the second and third quartiles of data with the median in between. Symbols: ♦, mean; ×, outlier data (greater than 1.5 times the range of the second and third quartiles from the median, designated by the whiskers); ^, rrn type A significantly lower than type B (ANOVA); *, rrn type A significantly lower than type B (χ2); ^^, rrn type A significantly lower than types B and AB (ANOVA); **, rrn type A significantly lower than types B and AB (χ2). P values are in the text.

