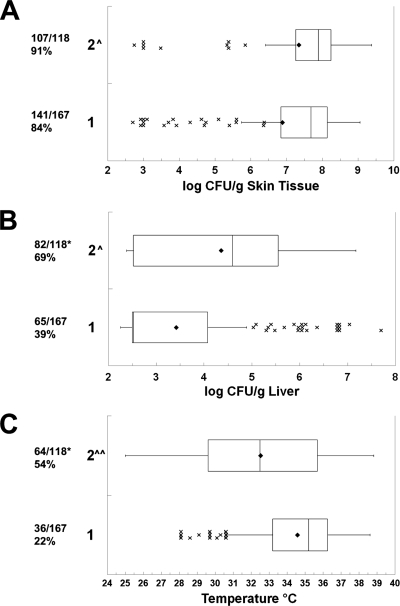
FIG. 5.
Relationship between MLST and virulence. Box plots show the relationships between MLST and (A) skin infection, (B) liver infection, and (C) body temperature at euthanasia. The MLST genotypes are shown on the left. For details, see the legend to Fig. 3. Symbols: ^, MLST 2 significantly higher than MLST 1 (ANOVA); ^^, MLST 2 significantly lower than MLST 1 (ANOVA); *, MLST 2 significantly higher than MLST 1 (χ2).

