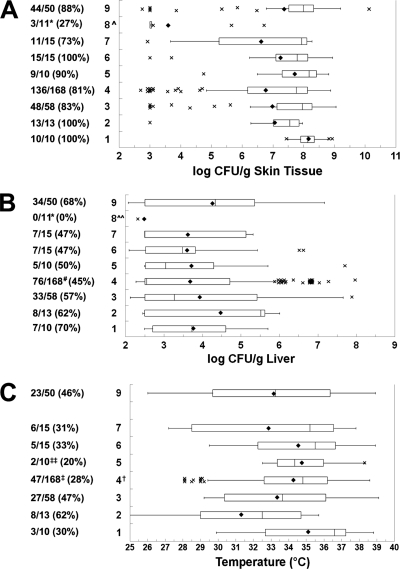
FIG. 6.
Relationship between rep-PCR type and virulence. Box plots show the relationships between rep-PCR group and (A) skin infection, (B) liver infection, and (C) body temperature at euthanasia. The rep-PCR genotypes are shown on the left. For details, see the legend to Fig. 3. Symbols: ^ and *, group 8 significantly lower than all other groups (ANOVA and χ2, respectively); ^^, group 8 significantly lower than groups 2 and 9 (ANOVA); #, group 4 significantly lower than group 9 (χ2); †, group 4 significantly higher than group 2 (ANOVA); ‡, group 4 significantly lower than groups 2, 3, and 9 (χ2); ‡‡, group 5 significantly lower than group 2 (χ2).

