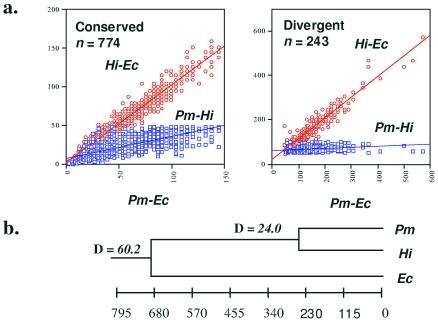
Figure 3.
Genome-scale evolutionary comparisons between Pm, Hi, and Ec. Scatter plots were created from pairwise evolutionary distance (D) values, as described. The x axis represents the pairwise D value for Pm and Ec and the y axis represents the pairwise D value for either Hi and Ec or Pm and Hi as indicated. (a) Scatterplot for the 774 conserved sequences and 243 divergent sequences. (b) Dendrogram showing the evolutionary distance in millions of years between Pm, Hi, and Ec. D values for each of the branch points are also presented.

