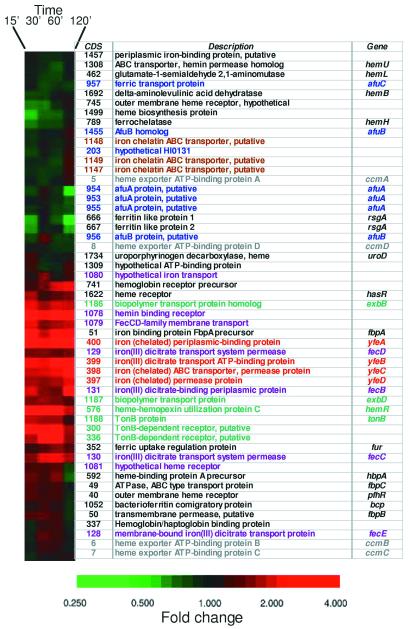
Figure 6.
Hierarchical clustering of 53 Pm CDSs identified based on sequence comparisons to be involved in iron metabolism or to require iron as a co-factor. Fluorescent ratios representing relative expression profiles of Pm CDSs at 15, 30, 60, and 120 min time points are shown in (Left). The red and green colors represent fold increase and decrease, respectively, in gene expression in response to low iron conditions (addition of the iron chelator, 2,2′-dipyridyl). Their corresponding open reading frames numbers and CDS descriptions are also shown. CDSs depicted in the same color are in close proximity to each other on the genome and may be a part of potential operons.

