FIG. 3.
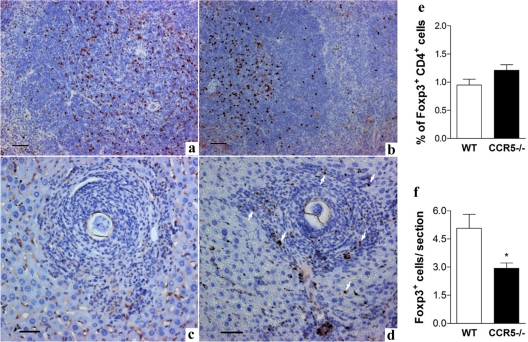
FoxP3+ cells in spleen and liver of wild-type and CCR5−/− mice after S. mansoni infection. Mice were infected with 25 cercariae and evaluated 8 weeks after infection. (a to d) Immunohistochemical analysis showing FoxP3+ cells (brown-stained nuclei) in spleen (a and b) and in liver granulomas induced by S. mansoni eggs (c and d). a and c illustrated tissue from infected CCR5−/− mice, and b and d illustrated tissue from infected WT mice. The arrows in d indicate FoxP3+ cells in the tissue section. The tissue samples were fixed with buffered formalin and embedded in paraffin, and 5-μm sections were incubated with affinity-purified anti-mouse/anti-rat Foxp3 and stained as described in Materials and Methods. Bars represent 10 μm. (e) Percentage of FoxP3+ lymphocytes (FoxP3+ CD4+) in the spleen of infected mice from both experimental groups, estimated by cytometric analysis. (f) The number of FoxP3+ cells/granuloma section was determined by the direct counting of FoxP3+ cells in liver tissue. There were at least 9 animals in each group. *, P < 0.05 for infected wild-type versus infected CCR5−/− mice.

