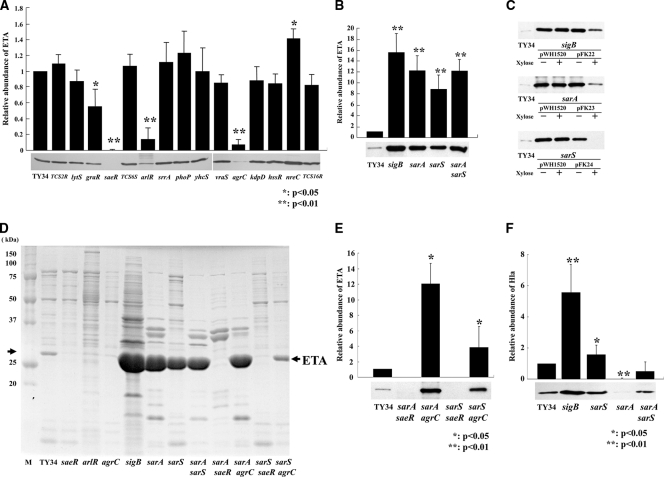
FIG. 1.
Comparison of levels of ETA production in wild-type strain TY34 and its regulator mutants. (A) Western immunoblot analysis of ETA production in the wild-type strain, TY34, and its 15 isogenic TCS gene mutants. (B) Western immunoblot analysis of ETA production in the wild-type strain, TY34, and its sigB (FK131), sarA (FK128), sarS (FK130), and sarA sarS (FK129) isogenic mutants. (C) Western immunoblot analysis of ETA production in the wild-type strain, TY34, and the sigB (FK131) mutant containing pWH1520 or pFK22, the sarA (FK128) mutant containing pWH1520 or pFK23, and the sarS (FK130) mutant containing pWH1520 or pFK24. Strains were grown in the presence (+) or absence (−) of 1% xylose. (D) SDS-PAGE analyses of the wild-type strain TY34 extracellular proteins and those of its saeR (FK104), arlR (FK106), agrC (FK111), sigB (FK131), sarA (FK128), sarS (FK130), sarA sarS (FK129), sarA saeR (FK132), sarA agrC (FK133), sarS saeR (FK134), and sarS agrC (FK135) isogenic mutants. M, molecular mass markers. (E) Western immunoblot analysis of ETA production in the wild-type strain, TY34, and its sarA saeR (FK132), sarA agrC (FK133), sarS saeR (FK134), and sarS agrC (FK135) isogenic mutants. (F) Western blot analysis of Hla production of the wild-type strain, TY34, and the sigB (FK131), sarA (FK128), sarS (FK130), and sarA sarS (FK129) mutants. The cells were grown in TSB with shaking at 37°C for 15 h, and culture supernatants were harvested by centrifugation. The concentration of ETA or Hla was detected by Western immunoblotting with antiserum as described in Materials and Methods. The intensity of each band was measured with the program NIH Image and quantified relative to that of wild-type strain TY34. The data are means from four independent experiments. Error bars denote standard deviations.

