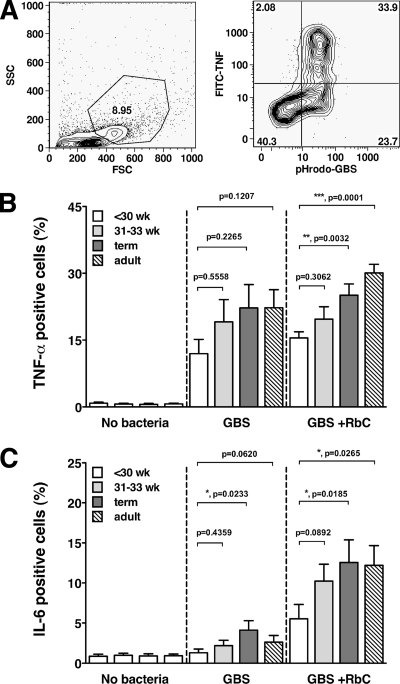
FIG. 5.
Monocyte-specific TNF-α and IL-6 production with respect to GBS uptake. CBMC and PBMC were exposed to 1 × 10⁸ CFU/ml pHrodo-HKGBS (plus or minus RbC) for 1 h and then washed and incubated for a further 4 h in the presence of brefeldin A before staining for intracellular cytokine. (A) Left panel, representative forward-scatter versus side-scatter FACS plot showing inclusion gate for monocytes; right panel, representative FACS plot showing monocyte-specific TNF-α production in association with ingestion of pHrodo-GBS. (B and C) Percentage of HKGBS-positive monocytes producing TNF-α or IL-6 (means ± SEM). n = 10 for the <-30-week group, 13 for the 31- to 33-week and term groups, and 14 for adults. P values (Mann-Whitney test) are as displayed.

