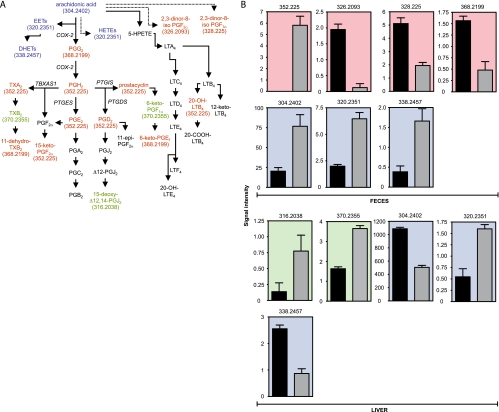
FIG. 3.
The effect of Salmonella infection on eicosanoid hormone metabolism. (A) Schematic of the eicosanoid hormone metabolic pathway. Colors indicate the organs in which a given hormone was affected by infection (5 days). Red indicates metabolites affected in feces, green indicates those affected in liver, and blue indicates those affected in both samples. Black indicates metabolites not detected or unchanged. Masses (Da) for metabolites affected are shown in parentheses. Solid arrows indicate direct steps, and dashed arrows indicate multiple steps that are not shown. Enzymes involved in some of the reactions displayed are shown in italics. (B) Levels of masses affected by infection (5 days) in the eicosanoid pathway. Masses are shown at the top of each graph. The y axis indicates mass signal intensity. Signal/noise ratios for metabolites shown varied between 14.2 and 14,641.2. Color scheme is the same as that described for panel A. Black bars represent uninfected samples, and gray bars indicate infected samples. Averages with standard errors of means are shown. Four samples were used for feces and three for livers, with duplicate measurements (n = 8 for feces and n = 6 for livers). Ions presumptively neutralized to a mass of 304.2402 Da using our method were detected in feces in both negative- and positive-ionization modes, and all results were used (n = 16). All P values were ≤0.0001, except for the metabolites in feces with masses of 338.2457 (P = 0.0023) and 304.2402 (P = 0.0008) Da and the metabolites in livers with masses of 316.2038 (P = 0.0492) and 320.2351 (P = 0004) Da. PG, prostaglandin; LT, leukotriene; TX, thromboxane; EET, epoxyeicosatrienoic acid; HETE, hydroxyeicosatetraenoic acid; HPETE, hydroperoxyeicosatetraenoic acid; DHET, dihydroxyeicosatrienoic acid.

