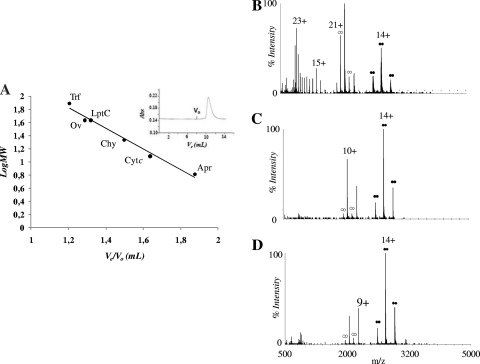
FIG. 8.
LptC dimerization in vitro. (A) Apparent molecular weight (MW) of LptC as determined by gel filtration. The relative elution volume of sH-LptC in 50 mM sodium phosphate (pH 8.0)-100 mM NaCl was compared to that of globular standards. The chromatogram is shown in the inset. Trf, transferrin; Ov, ovalbumin; Chy, chymotrypsin; Cytc, cytochrome c; Apr, aprotinin; Ve, elution volume; Vo, void volume; Abs, absorbance at 280 nm. (B, C, and D) Quaternary structure of LptC by mass spectrometry. The nano-ESI-MS spectra of 5 μM LptC in 50 mM ammonium acetate (pH 7.5) (B), 5 μM LptC in 500 mM ammonium acetate (pH 7.5) (C), and 20 μM LptC in 500 mM ammonium acetate (pH 7.5) (D) are shown. The main charge state of each peak envelope is labeled by the corresponding number of charges. Dimer-specific peaks are labeled by double circles. Solid symbols correspond to compact dimers, and open symbols correspond to less compact dimers.

