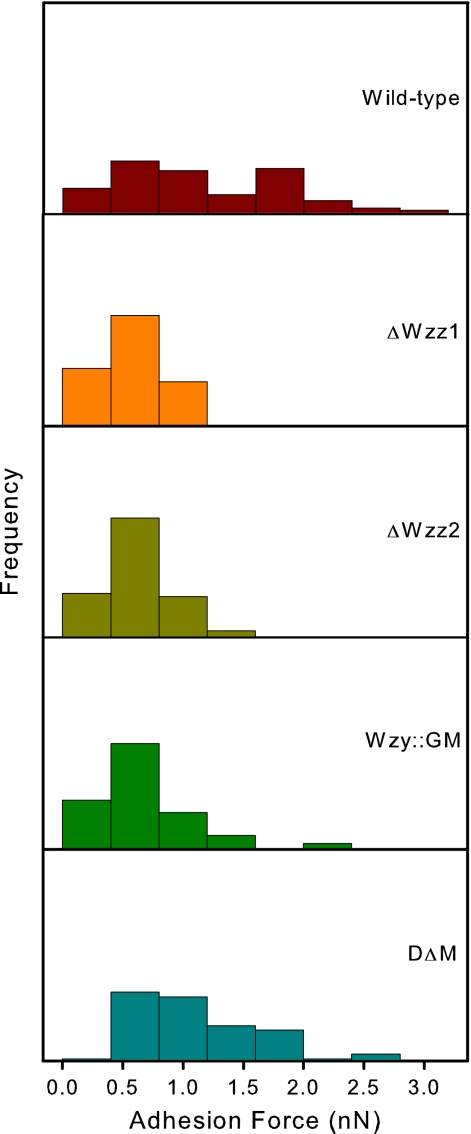
FIG. 7.
Histogram of force data obtained from AFM experiments. PA103 shows the broadest distribution range, while the force values obtained from ΔWzz1, ΔWzz2, and Wzy::GM show similar Gaussian distribution patterns. The frequency along the vertical axis ranges from 0 to 100% for each of the treatments.

