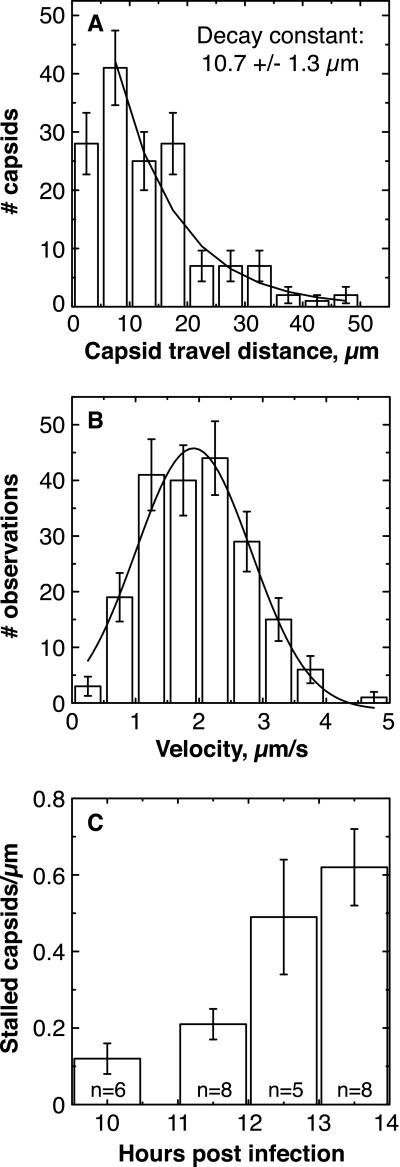
Figure 3.
Analysis of capsid movement. (A) Histogram of lengths of
anterograde runs. Error bars are expected uncertainty, assuming
Gaussian statistics N).
The smooth curve is the best fit decaying exponential (reduced
χ2 = 1.24; P = 0.28); bin 1 was
excluded from the fit because our temporal resolution was insufficient
to resolve short runs. An exponential distribution is consistent with
processivity-determined runs. The maximum length of observed runs was
experimentally limited by the size of the observation window (30–50
μm). (B) Histogram of velocities of anterograde runs.
Each data point used in the histogram was the average velocity of a
moving capsid, calculated by dividing the spatial length of the run by
its temporal duration. Error bars are expected uncertainty, assuming
Gaussian statistics  . The
smooth curve is the best fit Gaussian (reduced χ2 =
1.02; P = 0.40) with a mean of 1.979 ± 0.063
μm/s and a width of 1.621 ± 0.121 μm/s.
(C) The number of stalled capsids per micrometer of axon
increased with time postinfection. This number was determined by
examining approximately 30 μm of each axon during an entire
recording, usually approximately 2 min in duration. The
n value in each bar is the number of different axons
examined. Error bars indicate the experimentally determined standard
error. Early data were pooled, resulting in the uneven spacing of bars
along the abscissa.

