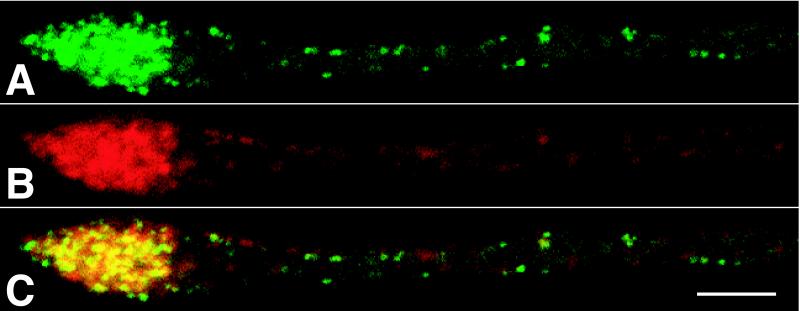
Figure 4.
Capsid and glycoprotein accumulation at axon terminals. Direct fluorescence of GFP-capsids (A) and indirect immunofluorescence of viral membrane protein gB (B) are shown. An overlay of A and B is shown in C. The terminal is visible at Left, whereas the cell body is out of the field to the right. Cells were fixed at 15 h.p.i. Time-lapse recordings of capsid accumulation at axon terminals are available as Movie 3 in the supplemental data (www.pnas.org). (Bar = 5 μm.)

