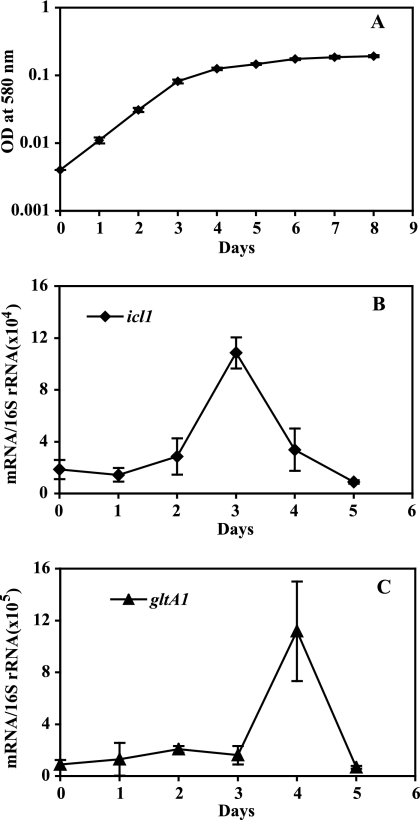
FIG. 1.
The hypoxic response of icl1 and gltA1. Cultures of M. tuberculosis were subjected to gradual O2 depletion (35). (A) Growth curve. In the Wayne model, cultures of M. tuberculosis continue to multiply for approximately 70 h and then stop growing (microaerophilia). After this time, the additional slow rise in absorbance is due to cell wall enlargement. Anaerobiosis ensues at around 200 h, with no further cell enlargement. Bacterial growth was monitored by measuring OD at 580 nm. (B and C) Enumeration of icl1 and gltA1 transcripts. Cultures subjected to gradual O2 depletion were harvested daily, RNA was extracted, and bacterial transcripts were enumerated by qPCR. Transcript copy numbers were normalized to 16S rRNA (29, 30). Three independent experiments were carried out, and means (± standard deviations [SD]) were calculated for normalized mRNA copy numbers at each time point. The results shown represent normalized copy numbers of mRNA for icl1 and gltA1 at each time point (one gene per panel, as indicated). Measurements performed using M. tuberculosis H37Rv and M. tuberculosis CDC1551 gave indistinguishable results (see Fig. S1 in the supplemental material), indicating that the hypoxic response of icl1 and gltA1 is conserved among different M. tuberculosis strains.

