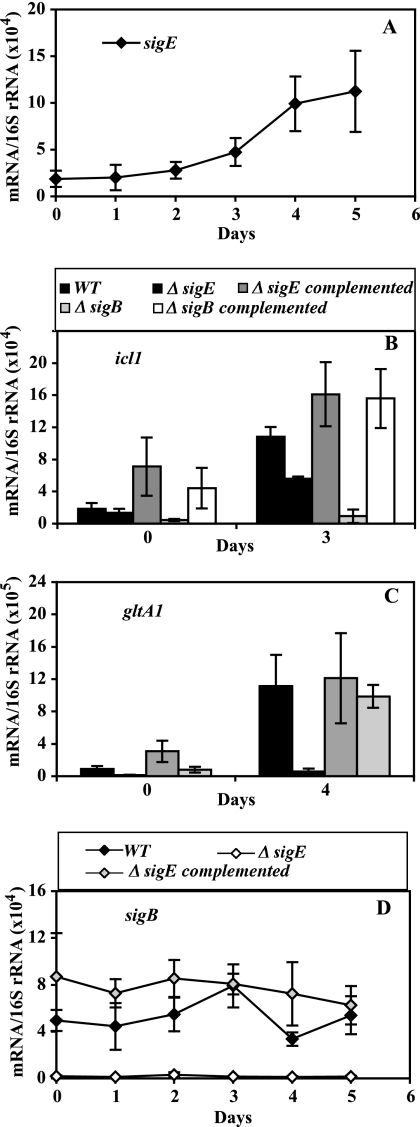
FIG. 2.
Effect of sigE and sigB inactivation on the hypoxic response of icl1 and gltA1. Wild-type and mutant cultures were subjected to gradual O2 depletion, cells were harvested, RNA was extracted, and bacterial transcripts were enumerated by qPCR, as described in the Fig. 1 legend. In all panels, means (± SD) for each time point were calculated from data from three independent experiments. For the duration of the treatment, CFU counts of wild-type and mutant strains were indistinguishable (see Fig. S2 in the supplemental material). Each panel presents data for one gene. (A) The hypoxic response of sigE. The results shown represent normalized copy numbers of the sigE transcript in wild-type cultures during 5 days of a hypoxic time course. (B and C) The hypoxic response of effector genes. The results shown represent normalized copy numbers of icl1 (B) and gltA1 (C) at mid-log growth (day 0) and at the day of peak gene activation (day 3 for icl1 and day 4 for gltA1) in wild-type, sigE and sigB mutant, and complemented mutant strains. (D) The hypoxic response of sigB. The results shown represent normalized copy numbers of the sigB transcript in wild-type, sigE mutant, and complemented sigE mutant cultures during 5 days of a hypoxic time course.

