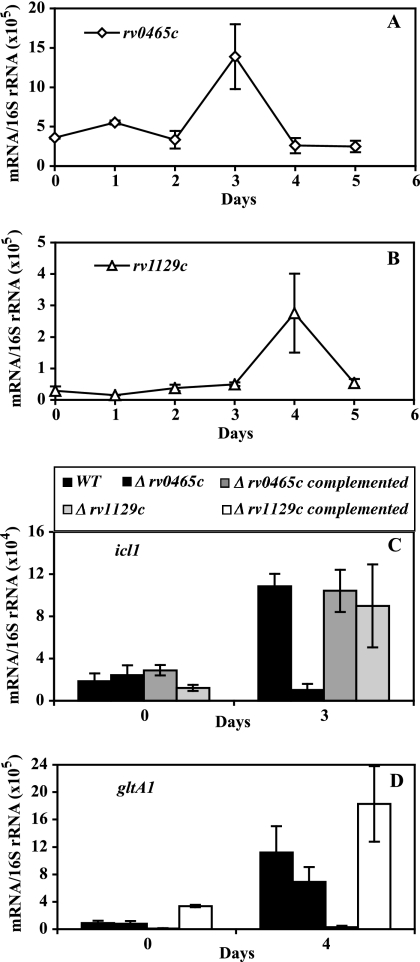
FIG. 4.
Characterization of adjacent regulatory factors. O2-depleted culture growth, RNA extraction, and mRNA enumeration by qPCR were conducted as described in the Fig. 1 legend. For the duration of the treatment, CFU counts of wild-type and mutant strains were indistinguishable (see Fig. S2 in the supplemental material). Each panel presents data for one gene. (A and B) The hypoxic response of rv0465c and rv1129c. The results shown represent normalized copy numbers of mRNA for rv0465c and rv1129c at each time point. (C and D) The hypoxic response of effector genes in wild-type and rv0465c and rv1129c transposon-insertion mutant strains. The results shown represent normalized copy numbers of icl1 and gltA1 at mid-log growth (day 0) and the day of peak gene activation (day 3 for icl1 and day 4 for gltA1) in wild-type and rv0465c and rv1129c mutant strains and the corresponding complemented mutant strains. Means (± SD) for each time point were calculated from data from three independent experiments.

