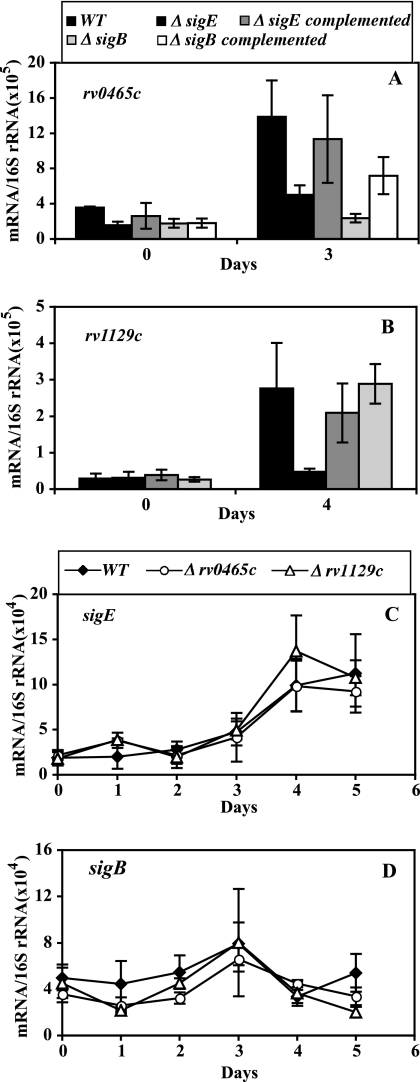
FIG. 5.
Regulatory interactions between sigE, sigB, rv0465c, and rv1129c. O2-depleted cultures, daily harvesting, and mRNA enumeration by qPCR were conducted as described in the Fig. 1 legend. Means (± SD) for each time point were calculated from data from three independent experiments. Each panel presents data for one gene. (A and B) Effect of sigE and sigB inactivation on the hypoxic response of rv0465c and rv1129c. Transcripts were enumerated and data are presented as described in the Fig. 2B and C legends. (C and D) Effect of rv0465c and rv1129c inactivation on the hypoxic response of sigE and sigB. Transcripts were enumerated and data are presented as described in the Fig. 2A to D legends.

