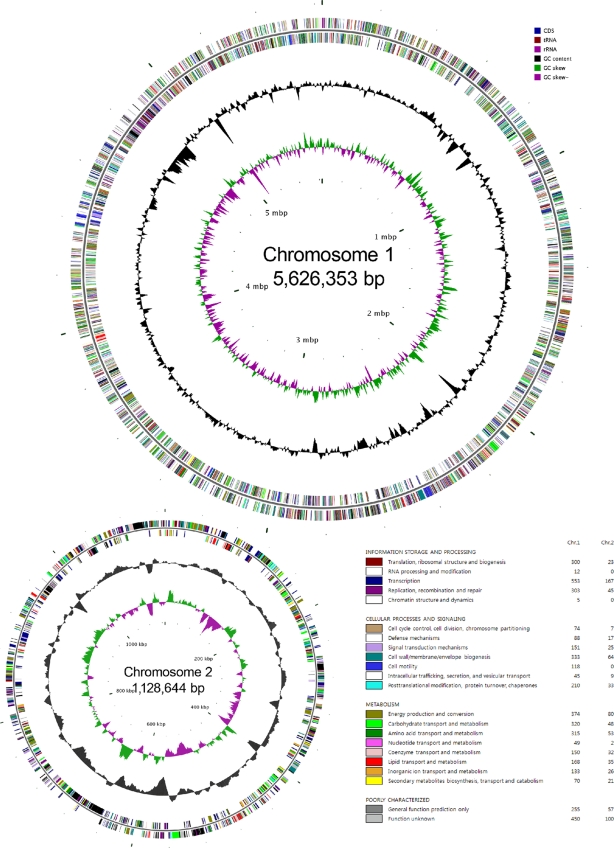
FIG. 1.
Genomes of V. paradoxus S110 chromosomes 1 and 2. The outer circle represents coding region with colors of COG categories, rRNA, and tRNA. The black circle represents GC contents, the green color shows the GC skew on the leading strand, and the pink color circle represents GC skew on the lagging strand. This figure was drawn with CGview. GC skew was calculated as (G − C)/(G + C), where G is the number of G's and C is the number of C's. The COG colors are defined (or categories) and the numbers of related genes are given at the bottom right of the figure.

