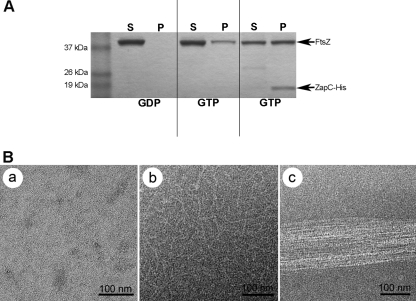
FIG. 4.
In vitro characterization of ZapC-FtsZ interactions. Both FtsZ and ZapC-His were at 5 μM concentrations when added to a total polymerization reaction volume of 100 μl. (A) Relative concentrations of FtsZ in supernatant (S) and pellet (P) from sedimentation assays were visualized by SDS-PAGE analysis. (B) Transmission electron microscopy images of reactions detailed in the sedimentation assays in part A with FtsZ in the presence of GDP (a), characteristic FtsZ protofilaments in the presence of GTP (b), or FtsZ bundles seen in the presence of ZapC-His (c).

