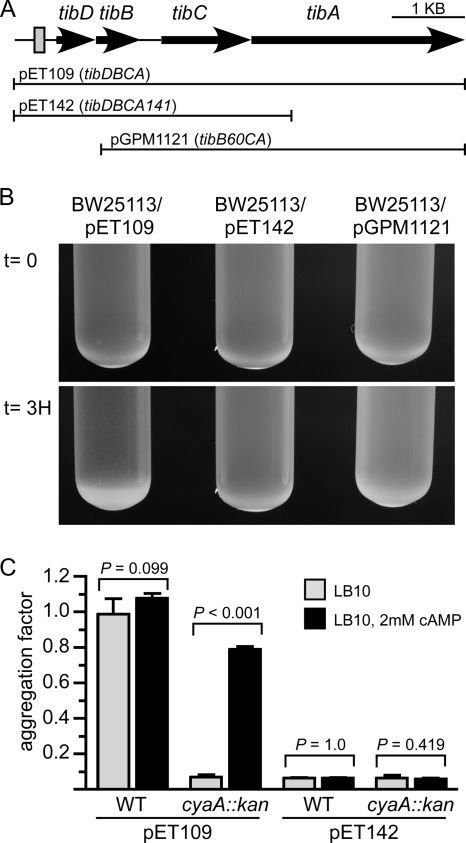
FIG. 2.
TibA-dependent aggregation. (A) Graphic depicting the chromosomal tib locus of ETEC strain H10407. The predicted CRP binding site upstream of tibDB is represented by a shaded rectangle. Solid lines represent regions of the tib locus carried by plasmids pET109 (tibDBCA), pET142 (tibDBCA141), and pGPM1121 (tibB60CA). (B) Representative stationary-phase cultures photographed immediately after mixing (t = 0) and 3 h after standing without agitation (t = 3H). (C) The absorbance (600 nm) of the upper fraction from stationary-phase cultures was read immediately after mixing and after the cultures were allowed to stand for 3 h without agitation. The difference between the two absorbance readings was used as the aggregation factor. Error bars represent the standard deviations of the means (n = 4). P values were calculated using the Student t test. WT, wild-type K-12 strain BW25113; cyaA::kan, K-12 strain JW3778.

